


Blog
From Spend Analytics to Category Intelligence
By Mark Webb |
Why spend visibility alone is not enough to build effective category strategies
Many procurement organisations have invested heavily in spend analytics tools and can now access spend cubes that provide visibility by supplier, category, business unit, geography, or cost centre.
This is undoubtedly an improvement over the days when category managers spent weeks extracting and cleansing transaction data from multiple ERP systems.
However, in our experience, the existence of a spend cube is often mistaken for having category intelligence.
It isn’t.
A spend cube answers important questions such as:
- Who are we spending with?
- How much are we spending?
- Which business units are spending?
- Which categories account for the largest spend?
- These are valuable insights, but they represent only the starting point for effective category management. The questions that drive category strategy
These are valuable insights, but they represent only the starting point for effective category management. The questions that drive category strategy development are often very different:
- What prices are we actually paying compared to contracted or expected rates?
- Why do prices vary between business units, sites, or suppliers?
- Which suppliers are delivering the highest levels of performance?
- Which specifications are driving costs?
- What are the underlying supplier cost drivers?
- How are market conditions affecting supplier pricing?
- What operational factors influence demand and consumption?
- Where do supply chain risks exist?
- Which costs create competitive advantage and which simply add complexity?
A spend cube alone rarely provides answers to these questions.
In this blog, we outline the various analytical angles category managers should apply to create category intelligence and develop more impactful category strategies.
From Spend Visibility to Category Intelligence
We frequently encounter organisations where category managers have access to good spend data but still struggle to develop robust category strategies because many other data elements are unavailable or fragmented.
For example, spend data may show that €50 million is being spent with a supplier, but it may not show:
- Whether contractual rates are being adhered to
- Whether service performance is improving or deteriorating
- Whether higher prices are justified by better outcomes
- Whether market conditions support a supplier’s requested price increase
- Whether alternative specifications could deliver the same outcome at lower cost
- Without this broader context, category managers are often forced to rely on assumptions, stakeholder opinions, or supplier assertions when developing strategies
Without this broader context, category managers are often forced to rely on assumptions, stakeholder opinions, or supplier assertions when developing strategies
A Practical Model for Building Category Intelligence
Leading organisations recognise that spend analysis is only one component of category knowledge. Category managers require a broader data foundation that combines spend, pricing, supplier performance, demand, operational, and market information.
This foundation should not be built during a category strategy exercise. It should be continuously developed and enhanced over time so that category managers can focus on identifying opportunities rather than collecting basic information.
The most mature organisations therefore move beyond spend visibility and invest in building genuine category intelligence. Their category managers are not simply analysing transactions—they are understanding the commercial, operational, supplier, and market dynamics that ultimately determine where value can be created.
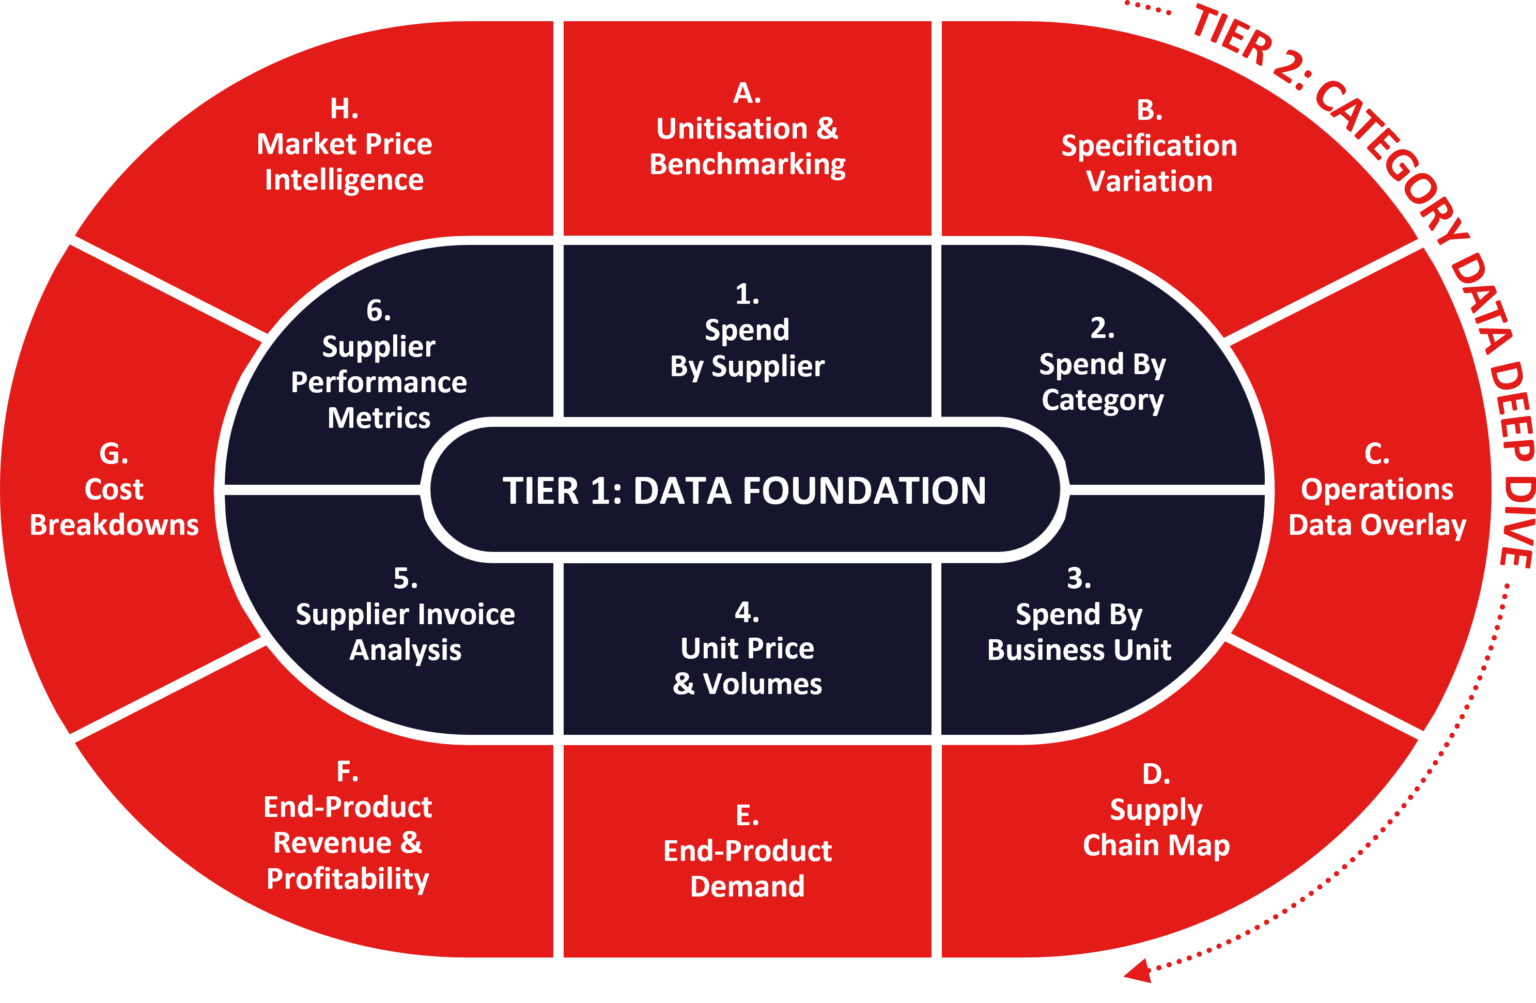
To address this shortfall, we have developed a practical model for building category intelligence. Drawing on our experience with leading organisations, the model defines the information that category managers need to move beyond spend reporting and develop strategies grounded in fact, insight, and commercial understanding.
The Model Consists of Two Tiers:
Tier 1
Category Data Foundation:
The essential information that every category should possess, regardless of spend level or complexity.
Tier 2
Category Data Deep Dive:
Project management skills in category management involve planning, executing, and overseeing procurement initiatives to optimize costs, supplier performance, and operational efficiency. By understanding how to coordinate cross-functional teams, manage timelines, and mitigate risks, a more structured focus is placed on implementing category strategies.
Together, these tiers provide a structured approach to building category intelligence over time, ensuring that strategy development starts with knowledge rather than a search for data.
The Procurement Data Foundation Every Category Manager Needs
1. Spend by Supplier
A comprehensive and accurate view of organisational expenditure by supplier, enabling category managers to understand supplier concentration, dependency, and opportunities for consolidation. Supplier spend data should be cleansed and normalised to eliminate duplicate supplier records resulting from naming variations, legal entities, acquisitions, or regional registrations (e.g., “Dell”, “Dell Inc.”, and “Dell Technologies” mapped appropriately). The dataset should also include supplier parent-child ownership hierarchies, allowing spend to be aggregated at both legal entity and corporate group levels.
Key requirements:
- Normalised and harmonised supplier master data
- Spend visibility by legal entity and parent company
- Currency of transaction and standardised reporting currency
- Historical spend trends and growth rates
- Segmentation of strategic, critical, and tail-spend suppliers
- Supplier concentration and dependency analysis
Business value: Supports supplier rationalisation, aggregation opportunities, risk assessment, negotiation leverage, and strategic supplier management.
2. Spend by Category
A robust classification of all expenditure into clearly defined procurement spend categories and sub-categories using a consistent category taxonomy. Category segmentation should be based on sound classification logic, with minimal miscoding and common standards applied across all business units, functions, and geographies. The analysis should include current, historical, and forecast expenditure, incorporating budget and financial planning data to project future category demand.
Key requirements:
- Consistent category taxonomy and definitions
- High classification accuracy and low miscoding levels
- Visibility of spend at category and sub-category level
- Historical spend trends and demand patterns
- Budget-based spend forecasting
- Cross-business and cross-regional spend comparisons
Business value: Provides the foundation for category strategy development, sourcing prioritisation, demand management initiatives, and future resource planning.
3. Spend by Business Unit
The ability to analyse and compare expenditure across organisational structures, including business units, divisions, functions, sites, regions, and countries. Category managers should be able to identify who is spending, where spending occurs, and which stakeholders influence purchasing decisions. The analysis should clearly link expenditure to cost centres, budget owners, and key decision-makers.
Key requirements:
- Spend reporting by business unit, geography, site, and function
- Visibility of cost centres and budget ownership
- Analysis of spending behaviours and consumption patterns
- Identification of high-spend locations and departments
- Comparison of purchasing practices across the organisation
Business value: Enables stakeholder engagement, supports compliance initiatives, identifies opportunities for standardisation, and highlights areas of fragmented purchasing.
4. Unit Price and Volume Visibility
Complete transparency of the prices paid for goods and services, alongside the quantities purchased and relevant units of measure. Information should be available at a transactional level to enable detailed benchmarking and price variance analysis. Historical pricing data should be maintained to identify rate movements, inflationary pressures, and contract performance over time.
Key requirements:
- Price paid per unit of measure
- Transaction currency and converted reporting currency
- Quantities purchased and consumption volumes
- Historical price and volume trends
- Price variance and benchmarking analysis
- Visibility of contracted versus actual pricing
Business value: Provides the evidence required to identify savings opportunities, support negotiations, benchmark supplier performance, and monitor compliance with agreed commercial terms.
5. Supplier Invoice Analysis
Supplier invoice analysis provides visibility of the actual prices being paid for goods and services compared with contracted, quoted, budgeted, or expected rates. By analysing invoice-level transactions, category managers can identify pricing variations, understand the drivers behind those variations, and determine whether they represent legitimate business requirements, supplier cost impacts, or commercial leakage.
Invoice analysis allows organisations to move beyond average spend and understand the specific circumstances under which higher or lower costs are incurred. Variations may be driven by factors such as customer demand patterns, service urgency, end-user preferences, product substitutions, regional requirements, overtime labour, expedited logistics, minimum order quantities, or supplier operational constraints. Understanding these drivers is essential to practically control future spend.
Key requirements:
- Invoice-level visibility of actual prices paid on line item level
- Comparison of invoiced rates against contracted, quoted, budgeted, or expected prices
- Identification of price variances across suppliers, locations, business units, and time periods
- Analysis of the causes of price differences and exceptions
- Visibility of premium-rate services, expedited deliveries, overtime charges, surcharges, and other cost additions
- Correlation of price variations with customer demand, operational requirements, and purchasing behaviours
- Validation of supplier compliance with agreed commercial terms
- Historical analysis of invoice pricing trends and variance patterns
Business value: Provides transparency of actual purchasing behaviour, identifies commercial leakage and non-compliance with agreed pricing, highlights opportunities to reduce unnecessary premium costs, and enables category managers to address the underlying operational or demand drivers that create price variation. This insight supports more effective supplier negotiations, demand management initiatives, and total cost optimisation.
6. Supplier Performance Metrics
Cost and spend analysis should always be considered alongside supplier performance data. Focusing solely on cost aspects can create a distorted view of value, whereas assessing supplier performance against agreed service, quality, delivery, and operational metrics provides a more balanced perspective on the true value being delivered.
A structured and comprehensive assessment of supplier performance includes operational, commercial, quality, risk, and relationship dimensions. Supplier performance metrics provide category managers with objective evidence of how effectively suppliers deliver against contractual obligations and business requirements. The analysis should combine quantitative performance data with qualitative stakeholder feedback to support informed supplier management and sourcing decisions.
Key requirements:
- On-time delivery and fulfilment performance
- Product and service quality performance, including defect and rejection rates
- Service level agreement (SLA) achievement and contract compliance
- Supplier responsiveness, issue resolution, and customer support effectiveness
- Health, safety, environmental, and sustainability performance indicators
- Risk measures, including financial stability, supply continuity, and regulatory compliance
- Innovation, value creation, and continuous improvement contributions
- Internal stakeholder satisfaction and supplier relationship assessments
- Historical performance trends and benchmarking against peers
- Supplier scorecards with weighted performance criteria
Business value: Provides a balanced assessment of value by considering cost, supplier performance, and operational outcomes together rather than in isolation.
Category Data Deep Dive
A. Unitisation & Benchmarking
Unitisation and benchmarking enable category managers to compare costs, consumption, and performance across suppliers, sites, business units, or geographic regions on a like-for-like basis. This is achieved by dividing expenditure by an operational driver or output measure, such as square metres maintained, units produced, miles travelled, customers served, transactions processed, or satisfaction scores delivered.
By normalising spend against a relevant activity measure, meaningful cost and performance comparisons can be made regardless of scale.
The objective is to identify significant variations in unit costs and operational performance, investigate the root causes of these differences, and determine whether they are driven by legitimate operational requirements or by inefficient practices and inconsistent standards. The resulting insight allows organisations to eliminate poor-performing approaches and replicate best practices across the business.
Key requirements:
- Identification of appropriate unit drivers for each category
- Spend normalised against operational activity measures
- Benchmarking across locations, business units, suppliers, and regions
- Visibility of cost, consumption, and performance variances
- Identification of best-performing and worst-performing operations
- Analysis of root causes behind cost and performance differences
- Internal and external benchmarking where available
- Continuous tracking of unit cost trends over time
Business value: Provides objective evidence of efficiency differences across the organisation, supports operational standardisation, highlights improvement opportunities, validates best practices, and enables targeted cost reduction initiatives based on proven performance benchmarks.
B. Specification Variation
Specification variation analysis examines the detailed products, services, and performance requirements that sit beneath category and sub-category spend. While category-level analysis identifies where money is being spent, specification analysis determines exactly what is being purchased and whether different specifications are creating unnecessary complexity, cost, or demand variation.
This requires visibility of part numbers, service descriptions, technical specifications, service levels, performance requirements, and associated pricing and volume information. The analysis enables category managers to assess whether differing specifications deliver genuine business value or whether opportunities exist to standardise requirements, simplify demand, rationalise product ranges, or optimise performance levels.
Key requirements:
- Detailed product, service, and part number visibility
- Mapping of specifications to spend, price, and volume data
- Identification of specification and performance variations
- Analysis of specification complexity and proliferation
- Visibility of supplier-specific versus standard specifications
- Assessment of business justification for specification differences
- Support for Value Analysis and Value Engineering (VA/VE) activities
- Correlation between specification requirements and operational outcomes
Business value: Enables demand management, product and service standardisation, reduction of unnecessary complexity, improved leverage with suppliers, and identification of cost reduction opportunities without compromising required business outcomes.
C. Operations Data Overlay
Operations data overlay combines procurement information with operational, production, maintenance, quality, service, or customer performance data to create a more complete understanding of value and total cost of ownership (TCO). While spend analysis can identify cost differences, operational data is often required to determine whether higher or lower costs produce a corresponding difference in business performance.
This approach allows category managers to assess the full economic impact of procurement decisions by linking purchasing activity to operational outcomes such as productivity, reliability, downtime, asset life, quality performance, service levels, customer satisfaction, energy consumption, or maintenance requirements.
Key requirements:
- Integration of spend and operational performance datasets
- Visibility of cost versus performance relationships
- Measurement of operational outcomes resulting from procurement decisions
- Analysis of lifecycle costs and total cost of ownership
- Validation of supplier claims regarding performance improvements
- Comparison of alternative products, services, and technologies
- Identification of cost drivers beyond purchase price
- Quantification of operational benefits and trade-offs
Business value: Supports evidence-based decision-making, enables robust total cost of ownership analysis, validates business cases for change, and identifies opportunities where higher-performing solutions can generate greater overall value despite higher acquisition costs.
D. Supply Chain Map
A Supply Chain Map provides a structured view of the suppliers, production facilities, service providers, logistics networks, and geographic locations that support the delivery of goods and services to the organisation. It begins with Tier 1 suppliers but can be extended to include lower-tier suppliers, subcontractors, manufacturing sites, distribution centres, and critical supply chain dependencies.
The objective is to create visibility of how products and services flow through the supply chain, where critical dependencies exist, and which suppliers, locations, or activities represent potential risks or opportunities. By understanding the end-to-end supply chain structure, category managers can identify vulnerabilities, improve resilience, support sustainability objectives, and make more informed sourcing decisions.
Key requirements:
- Mapping of Tier 1 suppliers and supply locations.
- Identification of key Tier 2 and Tier 3 suppliers where relevant.
- Visibility of manufacturing, service delivery, and distribution locations.
- Understanding of product, material, and service flows through the supply chain.
- Identification of critical dependencies and single-source exposures.
- Geographic mapping of supply risks and concentrations.
- Visibility of logistics routes and transportation networks.
- Integration of supplier risk, ESG, and business continuity information.
- Identification of switching constraints and alternative supply sources.
Business value: Creates transparency across the supply chain, enabling organisations to identify critical dependencies, assess supply continuity risks, improve supplier resilience, support ESG and compliance objectives, and make better-informed sourcing and supplier management decisions.
E. End-Product Demand
End-product demand analysis provides visibility of how customer demand for the organisation’s products or services fluctuates over time and how those fluctuations impact procurement requirements. By understanding seasonality, growth trends, promotional activity, customer buying behaviours, and demand volatility, category managers can better anticipate future requirements and align suppliers to changing business needs. The Sales & Operations Planning (S&OP) process provides meaningful input to this approach.
Mapping demand patterns against spend and supplier capacity allows procurement teams to engage suppliers more strategically, providing them with improved forecasting information and enabling more collaborative planning. This can improve service levels, reduce supply risk, optimise inventory positions, and create opportunities for stronger commercial agreements based on greater certainty of future demand.
Key requirements:
Historical and forecast customer demand data
Analysis of seasonal, cyclical, and event-driven demand patterns
Demand profiles by product, service, market, customer segment, or geography
Correlation of demand changes to procurement activity and supplier performance
Visibility of supplier capacity requirements and constraints
Forecast sharing and collaborative planning opportunities
Identification of demand volatility and supply risks
Integration with sales, operations, and production planning processes
Business value: Improves demand forecasting accuracy, strengthens supplier collaboration, supports capacity planning, reduces supply chain risks, and enables more strategic sourcing and negotiation activities based on a shared understanding of future business requirements.
F. End-Product Revenue & Profitability
End-product revenue and profitability analysis overlays procurement and supply chain costs against the revenue and profit generated by the organisation’s products and services. Rather than focusing solely on category-level cost reduction, this approach evaluates procurement decisions in terms of their contribution to broader business profitability and commercial success, supporting the broader discussion around the Procurement value-add.
By grouping procurement spend around customer-facing products, services, or business offerings, category managers can identify where procurement interventions can have the greatest impact on margin improvement, revenue growth, or competitive advantage. This analysis supports cross-functional collaboration between procurement, operations, sales, marketing, product management, and finance to optimise value across the entire value chain.
Key requirements:
- Revenue and profitability data by product, service, customer, or market segment
- Allocation of procurement costs to end products and services
- Analysis of product-level margins and profitability drivers
- Visibility of high-revenue and strategically important offerings
- Identification of cost reduction opportunities impacting profitability
- Assessment of supply risks affecting revenue generation
- Cross-category spend analysis linked to end-product performance
- Support for product portfolio and commercial decision-making
Business value: Aligns procurement strategy with business growth objectives, improves profitability, supports revenue protection, identifies cross-category value opportunities, and ensures procurement resources are focused on areas with the greatest commercial impact.
G. Cost Breakdowns
Cost breakdown analysis, often referred to as Purchase Price Cost Analysis (PPCA), is the process of understanding and estimating the underlying cost structure of a supplier’s product or service. By decomposing supplier pricing into its constituent elements, category managers gain insight into how supplier costs are created and where opportunities may exist to influence pricing outcomes.
Typical cost elements may include raw materials, labour, energy, manufacturing overheads, logistics, packaging, administration, and profit margin. By understanding these cost components and utilising them in sourcing activities creates a fact-based foundation for supplier discussions, negotiation strategies, value engineering initiatives, and should-cost modelling activities.
Key requirements:
- Breakdown of supplier pricing into major cost elements
- Estimation of percentage contribution from each cost driver
- Comparison of cost structures across suppliers
- Visibility of material, labour, manufacturing, logistics, and overhead costs
- Understanding of specification and process-related cost drivers
- Should-cost and target-cost modelling capability
- Validation of supplier pricing changes and adjustment requests
- Integration with commodity and market price intelligence
Business value: Strengthens negotiation effectiveness, improves commercial transparency, identifies cost reduction opportunities, enhances supplier challenge processes, and enables data-driven purchasing decisions based on a deeper understanding of supplier economics.
H. Market Data Overlay
Market Data Overlay provides category managers with visibility of the external market factors that influence the cost of goods and services purchased by the organisation. This involves integrating relevant commodity, labour, energy, transportation, currency, and industry-specific market data with procurement and supplier information to better understand cost movements and commercial risk.
Market data may be relevant where the organisation directly purchases commodities such as utilities, metals, chemicals, or fuel, or where these inputs represent a significant proportion of a supplier’s underlying cost base. Overlaying market intelligence onto procurement analysis enables category managers to understand the drivers of supplier pricing, track market trends, and assess the validity of supplier requests for price increases or decreases.
Key requirements:
- Access to relevant commodity and market indices
- Visibility of energy, utility, labour, logistics, currency, and material cost trends
- Understanding of key cost drivers within supplier cost structures
- Historical and current market price tracking
- Correlation of market movements with supplier pricing changes
- Monitoring of inflation, supply constraints, and market volatility
- Identification of favourable and unfavourable market conditions
- Integration of market intelligence into sourcing and contract strategies
Business value: Provides an informed understanding of external cost drivers and market dynamics, enabling procurement teams to make better-informed commercial decisions. By linking supplier pricing to underlying market conditions, category managers can validate supplier price movements, strengthen negotiations, improve budgeting and forecasting accuracy, identify opportunities to capture market-driven savings, and proactively manage cost risks before they impact organisational performance.
Building Category Intelligence
The importance of using broader data and evidence to support procurement decision-making is increasingly recognised across private and public sector organisations (OECD – Public Procurement https://www.oecd.org/gov/public-procurement/).
At Future Purchasing, we help organisations develop and leverage Category Intelligence to develop more robust, insightful, and impactful category strategies. Developing and delivering trainings around Category Management and Spend Analytics and working with category teams on targeted category strategy reviews and interventions, we have seen the impact of robust spend and data analysis on the quality of strategies and the perception of Procurement.
Whether you want to improve your data foundation, increase the analytical skills of your category managers, or strengthen your category toolkit with stronger analytics frameworks, we can help you move beyond spend analytics and build deeper Category Intelligence .
Get in touch to discuss how we can help your team ask the right questions.

About Mark Webb
Managing Director
30+ years procurement experience in line management
and consulting roles.
Previous employment: Price Waterhouse, Mobil Oil and QP Group
Education: BSc in Management Science and MSc in Business by Research, Aston University
CIPS: Member